Cours SPSS Pivot Table Object or SPSS Chart Object, tutoriel & guide de travaux pratiques en pdf.
Data handling
File
New
SPSS has a variety of different types of files. The most frequently used ones are: the Data file (*.sav) which stores the data, the Output file (*spo), which stores charts, tables, and results of statistical analyses, and the Syntax file (*sps) which experienced SPSS users can use to run SPSS commands.
Open
With this option you can open a data file, an output file, or a syntax file. The data files can originate from SPSS (*.sav), or from other programmes such as Systat, Lotus, and Microsoft Excel.
To open an Excel data file, you must specify at the bottom of the dialog box that you want Excel (*.xls) files to be displayed only (Dialog box 5). Then, locate the folder where the Excel file is stored, highlight the file, and click Open.
A new dialog box (Dialog box 6) will appear which will ask you to select the parts of the Excel file you want to import.
The first row of the Excel file should contain the names of the variables. Tick the option Read variable names from the first row of data to label the imported variables (columns) in SPSS with the variable names that appear in the first row of the Excel file. Excel has multiple worksheets and you can specify which worksheet you want to open. If you want to open a part of a worksheet, you can specify a range of cells to be imported. In Dialog box 6, SPSS will import the first twenty rows (1–20) from the first two columns (A and B).
Note that if you have SPSS version 9 or an earlier version, and you want to open an Excel data file, you need first to save that file as Excel version 4. To find out which version of SPSS you have, select About in the Help menu.
Read Text Data
Use this option to open ASCII or text data files. These are very basic types of data files and are often used as a ‘common currency’ to exchange data files between different software. Data files from software not supported by SPSS (e.g., Statistica) have to be saved as text files in the original software, so that SPSS will be able to read them. Similarly, if you want to open your SPSS data file (*.sav) in another software which does not support SPSS, you must save the SPSS data file as a text file (see Save As below).
First locate in your computer the appropriate text data file. Then click open in Dialog box 7.
A text wizard appears with six steps. At step 1 (Dialog box 8), SPSS asks you whether the text file matches a predefined format. Select Yes if you have used the text wizard before to create a data format (see step 6 below). If you have not used the text wizard before, select No. At the bottom of the text wizard you can see a preview of the data file. Click Next .
At step 2 (Dialog box 9), you need to specify how the variables are arranged in the original data file so that SPSS will know where the values of one variable begin and where they finish. The different variables can be separated (delimited) in the original file by a specific character such as a comma, a space, or a tab. In such a case, the variables have the same order (variable 1 followed by variable 2, etc.) for all cases (participants), but they are not necessarily in the same column location (e.g., variable 1 of case 2 may not be located straight under variable 1 of case 1). When each variable is recorded in the same column location for each case you need to use the Fixed width option. With this option no delimiters are required and the variables are arranged one after the other without spaces between them.
At step 2, you should also specify whether the original data file has variable names at the top of the file or not. At the bottom of the text wizard you can see a preview of the data file.
At step 3 (Dialog box 10), identify on which line number the first case begins. If the first line contains the variable names, then you should type 2 (i.e., the first line begins on line 2). At this step you also need to specify how many lines represent a case (participant). You are strongly advised to use only one line per case. You can choose to import all cases, a certain number of cases (the first n cases), or a percentage of the cases.
At step 4 (Dialog box 11), the text wizard shows a preview of how vertical lines separate the variables in the original data file. If the separation is not correct, you can move a vertical line to the correct position (modify), insert a new vertical line, or delete an existing one. In Dialog box 11 there are 13 variables separated by 13 vertical lines.
If at step 2 (Dialog box 9) you had specified that the variables should be delimited by a specific character, then step 4 would have had a different dialog box (Dialog box 12). At the top of the text wizard you would have needed to specify which delimiter appears between variables (e.g., space). Also, the data preview would have been different with each variable appearing in a different column.
Let us continue from Dialog box 11. At the next step, step 5 (Dialog box 13), highlight one variable at a time in the Data preview window and specify its name and type (data format). The variable name should contain no more than eight characters. No spaces are permitted between the letters. If you have specified at step 2 (Dialog box 9) that variable names are included at the top of the file, then these names would have appeared in the data preview of Dialog box 13. For the different types of data formats see Data Entry in Chapter 1. Click Next .
At the last step, step 6 (Dialog box 14), you are given the chance to save this file format for future use. Select Yes if you have other similar text files and you want to import them in a similar way. If you select Yes, next time you open a new similar text file you can indicate that the new file matches a predefined format (see step 1, Dialog box 8).
If you are an experienced SPSS user, you may want to paste the commands onto the Syntax window. Otherwise, select No. Click Finish, and the text data file will be imported into SPSS. Save the new file as a SPSS data file (*.sav).
Save As
Data files can be saved as earlier SPSS data file versions, as Excel files, or as text files (ASCII).
Display Data Info
This option provides useful information regarding a data file, the variables it contains, their labels and their format. It is similar to the File info option in the Utilities menu, but it is used to display information for stored files only, and not for a file which is open. Table 1 is an example of using this option.
Apply Data Dictionary
This option is useful when you are working with a new data file which has some variables in common with an existing data file. To save you the trouble of applying labels, missing values, and formats to these variables (see Data entry in Chapter 1), locate the existing data file using apply data dictionary, and click OK. SPSS will apply for you the labels, missing values, and formats to these common variables based on the information stored in the existing file. Variables that are not common in both files are not affected. Also, the common variables do not have to be in the same order in the two files. Note that if the variable type is not the same in both files (e.g., if variable A in the new file is string and in the existing data file is numeric) only the variable label is applied.
Page Setup
This option is available in an Output window only. In the first dialog box, similar to a Microsoft Word document, you can specify the size, the orientation, and the margins of the output page (Dialog box 15). Click on the Printer button to change the printer or its properties.
Click Options. In the Header/Footer tab you can provide a title for the header and the footer (Dialog box 16).
Click on the A button in the middle of the dialog box to change the font size, type, and colour of the title. The next three buttons change the justification of the text. Click on the next four items if you want to print the date, time, page number, and the name of the file. Click on the last four icons if you want to change the level of the title heading (see Outline in the Edit menu).
Click on the Options tab in Dialog box 16. Under Printed Chart Size you can specify the size of the printed chart relative to the page. The chart can be left as it is, or it can reach full page, half page, or quarter page height. The chart’s width-to-height ratio is not affected by these changes. Note that the maximum increase in a chart’s size is reached when its outside frame (see outer frame in the Chart menu) reaches the left and right borders of the page.
Lastly, in Dialog box 17, you can increase or decrease the distance between printed items (tables, charts, and texts), and change the pagination of the printed pages.
1 Introduction
Data Entry
2 Data handling
File
New
Open
Read Text Data
Save As
Display Data Info
Apply Data Dictionary
Page Setup
Print Preview
Print
Send Mail
Export Output
Edit
Undo
Find
Options
Outline
SPSS Pivot Table Object or SPSS Chart Object
View
Value Labels
Expand/Collapse
3 Statistical tests
Analyze
Reports/OLAP (Online Analytical Processing) Cubes
Descriptive Statistics/Frequencies
Descriptive Statistics/Descriptives
Descriptive Statistics/Explore
Descriptive Statistics/Crosstabs
Custom Tables/Basic Tables
Custom Tables/General Tables
Custom Tables/Multiple Response Tables
Custom Tables/Tables of Frequencies
Compare Means/Means
Compare Means/Independent-Samples T Test
Compare Means/Paired-Samples T Test
Compare Means/One-Way ANOVA
General Linear Model/Univariat
General Linear Model/Multivariate
General Linear Model/Repeated Measures
Correlate Bivariate
Correlate Partial
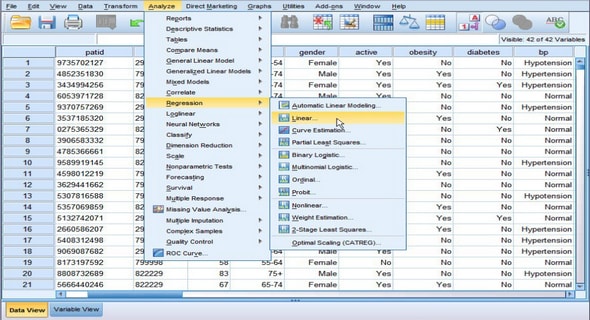
Regression/Linear
Classify/Discriminant
4 Chart and table options
Graphs
Bar
Error Bars
Options
Axis
Bar Spacing
Series
Line Style
3-D Rotation
Group
Hide
Hide/Show Dimension Label
Show All Categories
Show All Footnotes