Cours SPSS Sorting Revisited: Sorting by multiple variables, tutoriel & guide de travaux pratiques en pdf.
Moving around the output window
Now that you have created some charts, crosstabs, and statistics results, it’s a good time to take a closer look at moving around the output window.
1. From the menu, select Window > Output1 – SPSS Viewer.
2. Move your cursor over the border between the panels, hold down the mouse button, and move the border to the right until you can read all the titles in the icons in the contents pane as in Figure 2.
3. Notice the icons on the left arranged in outline format.
4. Click the icon named Interactive Graph. The output displays moves to the first graph you created in this session.
5. Notice the “-” to the left of the Output icon. The “-” indicates that a topic is fully expanded.
6. Click the “-” next to Output. The “-” changes to a “+” and all the output is now hidden. If you ever “lose” output on the window, check to see if the output is hidden.
7. Click “+” next to Output to expand the items again.
8. Click the icon named “Crosstabs.”
9. Holding down the left mouse button, drag “Crosstabs” up above “Interactive Chart.” You can use the drag function to arrange your output in any order you like.
10. Below Crosstabs, click the icon for Title.
11. Click the icon for Chi-square tests. Notice that the red arrow next to the icon corresponds to the red arrow in the actual output window.
12. Under Interactive Graph, click Bar Chart.
13. Above the actual chart, double-click the title (“Interactive Graph”).
14. Select all the text and type: Distribution of job category by gender
15. Click anywhere outside the title to apply the change.
16. In the navigation pane, click Title under Interactive Graph.
17. Wait about one second, then click Title again to activate the text.
18. With the text selected, type: Distribution of job category by gender
19. Press Enter or click anywhere outside the title to apply the change.
Use the title function in the navigation pane to indicate what each piece of output it contains. “Distribution of job category by gender” is a lot more informative than “Title.”
Sorting Revisited: Sorting by multiple variables
SPSS provides sophisticated sorting functions. You can sort by multiple variables, and you can set the sort order for each variable. For example, you could sort in order of increasing income, decreasing birthdate, and increasing expenditures. In the following task, you’ll sort the employee data set by gender (increasing) and current salary (decreasing).
1. Switch back to the data view by selecting Window > Employee data.sav – SPSS Data Editor.
2. From the menu, select Data > Sort Cases.
3. Clear any criteria that might already be in the Sort by pane by double-clicking them.
4. Double-click gender and current salary to move them to the Sort by pane.
5. Click once on gender.
6. If it is not already selected, select Ascending.
7. Click once on current salary.
8. Click Descending.
9. Click OK. Notice that all female employees are now listed first, in descending salary order.
Utilities: variable and file information
Tucked quietly under the Utilities menu are two especially useful functions: Variables and File Info. You can use these functions to get a snapshot of each variable in the file (Variables) and all variables together (File Info).
Utilities > Variables
The Variables function provides all the information about each variable in your data file, including any categorical codes and their value labels.
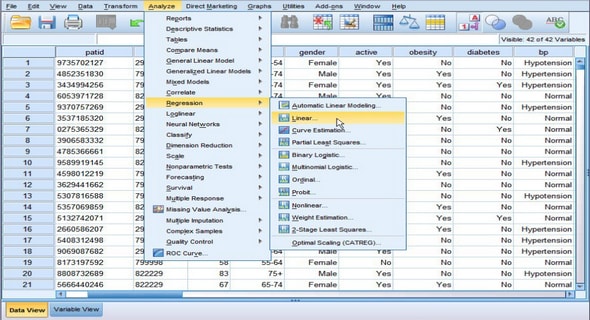
1. From the menu, select Utilities > Variables. (Figure 3)
2. In the variable list, click jobcat. Notice that the Variable Information pane displays the variable name, label, defined missing value, measurement level, values, and value labels.
3. Click salary. This value is a scale variable (continuous) and so has no value labels.
4. The Go To button takes you to the specific variable within a selected case or to the variable in the first case if no case is selected.
5. Click Close.
Utilities > File Info
The File Info window provides information about all variables in the file. This is extremely useful information. We recommend that you print out the file definition regularly and keep it close at hand.
1. From the menu, select Utilities > File Info.
2. Scroll through the output to see how each variable is described. Because this information goes to the output window, be sure that you print only the File Info output.
3. In the navigation pane, click once on the File Information icon.
4. Press Ctrl-P to open a print dialog window. Notice that under Print Range you can select All Visible Output or Selection. When you print the File Info, be sure to select Selection.
5. Click Cancel.*
1 Transformations and recoding
revisited
Introduction
Value labels
SPSS Tutorial and Help
Using online help
Using the Syntax Guide
Using the statistics coach
Moving around the output window
Sorting Revisited: Sorting by multiple variables
Utilities: variable and file information
Utilities > Variables
Utilities > File Info
Data Transformations
Computing new variables
Performing calculations with a variable and a function
Creating expressions with more than one variable
Conditional expressions
Creating subsets
Deeper into crosstabs
Crosstab Statistics
Crosstab cells
Adding layers to crosstabs
When to include zeros in a mean
Gender, geography, and exercise: the universal variables
Summary
2 Statistical procedures
Introduction
Measuring association
Bivariate correlations
Partial correlation
Multiple correlation (multiple regression)
Crosstabs
Measuring differences
T-Tests
ANOVA
One-Way ANOVA
Summary