Graphs
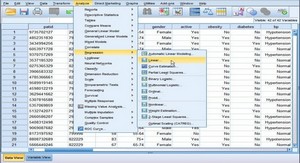
All of the following exercises use the grades.sav sample data file.
1. Using a bar chart, examine the number of students in each section of the class along with whether or not student attended the review session. Does there appear to be a relation between these variables?
2. Using a line graph, examine the relationship between attending the review session and section on the final exam score.
What does this relationship look like?
3. Create a boxplot of quiz 1 scores. What does this tell you about the distribution of the quiz scores? Create a boxplot of quiz 2 scores. How does the distribution of this quiz differ from the distribution of quiz 1?
Which case number is the outlier?
4. Create an error bar graph highlighting the 95% confidence interval of the mean for each of the three sections’ final exam scores.
What does this mean?
5. Based on the examination of a histogram, does it appear that students’ previous GPA’s are normally distributed?
6. Create the scatterplot described in Step 5f. What does the relationship appear to be between gender and academic performance (total)? Add a regression line to this scatterplot. What does this regression line tell you?
7. By following all steps on pages 90 and 91, reproduce the bar graph shown on page 91.
8. By following all steps on pages 92 and 93, reproduce the line graph shown on page 93.
9. By following all steps on pages 93, reproduce the pie chart shown on page 93.
10. By following all steps on page 94, reproduce the Boxplot shown on page 95.
11. By following all steps on pages 95 and 96, reproduce the Error Bar Chart shown on page 96. Note that the edits are not specified on page 96. See if you can perform the edits to produce identical output.
12. By following all steps on pages 96 and 97, reproduce the histogram shown on page 97.
13. By following all steps on page 98, reproduce the scatterplot shown on page 98.
SPSS statistics step by step answers to selected exercises (1,50 MO) (Cours PDF)
