Cours SPSS Step-by-Step Tutorial, tutoriel & guide de travaux pratiques en pdf.
Installing files from the Internet
Before you begin to download the files, create a new folder on your computer’s hard disk named SPSSTutorialData. When you download the files, you’ll save them in this directory.
1. Go to ftp.datastep.com. Do not type “www” or “http://”.
2. When prompted for a user name, enter: SPSS
3. For the password, enter: tutorial.
4. To download each file, click it once, press Ctrl-C or select Edit > Copy from the menu.
5. Switch to a window for your computer and save the file in the directory named SPSSTutorialData. To do so, open the folder and press Ctrl-V or select Edit > Paste from the menu.
6. Once you have downloaded all the files, close the Internet browser.
Installing files from the diskette
1. With the diskette in the floppy drive, open a window for the C drive on your computer (or any other drive where you want to save the data files).
2. Create a new folder named SPSSTutorialData.
3. Copy the files from the floppy disk to the SPSSTutorialData folder by copying and pasting or by dragging.
Introducing the interface
When you use SPSS, you work in one of several windows: the data view, the variable view, the output view, the draft output view, and the script view. Eventually you’ll also use the syntax editor (think: code) to save or refine your queries.
The data view
The data view displays your actual data and any new variables you have created (we’ll discuss creating new variables later on in this session).
1. From the menu, select File > Open > Data.
2. In the Open File window, navigate to C:\SPSSTutorialData\Employee data.sav and open it by double-clicking. SPSS opens a window that looks like a standard spreadsheet. In SPSS, columns are used for variables, while rows are used for cases (also called records).
3. Press Ctrl-Home to move to the first cell of the data view.
4. Press Ctrl-End to move to the last cell of the data view.
5. Press Ctrl-Home again to move back to the first cell.
The variable view
‘At the bottom of the data window, you’ll notice a tab labeled Variable View. The variable view window contains the definitions of each variable in your data set, including its name, type, label, size, alignment, and other information.
1. Click the Variable View tab.
2. Review the information in the rows for each variable.
Note: While the variables are listed as columns in the Data View, they are listed as rows in the Variable View. In the Variable View, each column is a kind of variable itself, containing a specific type of information.
3. Click the Data View tab to return to the data.
4. Double-click the label id at the top of the id column. Notice that double-clicking the name of a variable in the data view opens the variable view window to the definition of that variable.
5. Click the data view tab again.
The output view
The output window is where you see the results of your various queries such as frequency distributions, cross-tabs, statistical tests, and charts. If you’ve worked with Excel, you’re probably used to seeing all your work on one page, charts, data, and calculations. In SPSS, each window handles a separate task. The output window is where you see your results.
Try it:
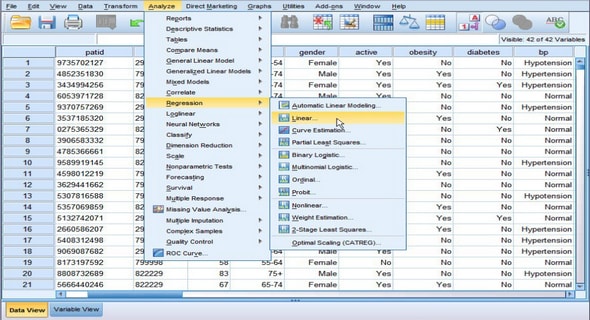
1. From the menu, select Analyze > Descriptive Statistics> Crosstabs.
2. Click once on Employment, then click the small right arrow next to Rows to move the variable to the Rows pane (Figure 1).
The draft view
The draft view is where you can look at output as it is generated for printing. The draft view does not contain the contents pane or some of the notations present in the output pane.
Try it:
1. From the menu, select File > New > Draft Output. SPSS opens a Draft Output window that contains its own menu.
2. From the menu, select Analyze > Descriptive Statistics > Crosstabs. Notice that the dialog box opens with your previous selections.
3. Click OK. From here you can select charts or tables, copy them, and paste them into other applications like spreadsheets or word processors.
Note: If you want to maintain the correct spacing of the tables, use a non-proportional font like Courier New.
The syntax view
SPSS has never lost its roots as a programming language. Although most of your daily work will be done using the graphical interface, from time to time you’ll want to make sure that you can exactly reproduce the steps involved in arriving at certain conclusions. In other words, you’ll want to replicate your analysis. The best method of preserving the exact steps of a particular analysis is the syntax view. In the syntax view, you’ll preserve the code used to generate any set of tables or charts.
1 SPSS Step-by-Step
Introduction
Installing the Data
Installing files from the Internet
Installing files from the diskette
Introducing the interface
The data view
The variable view
The output view
The draft view
The syntax view
What the heck is a crosstab?
2 Entering and modifying data
Creating the data definitions: the variable view
Variable types
4 SPSS Step-by-Step
Variable names and labels
Missing values
Non-numeric numbers, or when is a number not a number?
Binary variables
Creating a new data set
Getting help in creating data sets and defining variables
Creating primary reference lists
Frequencies
Descriptive statistics: descriptives (univariate)
Recodes and Transformations
Backup the original file
Recoding existing variables
Recode income data
Recoding variables revisited
The one exception in recoding variables
The other exception
3 Charting your data
Using the automated chart function
Using the Interactive Chart function
Creating a chart from scratch