Cours top Ten Things You Need to Know About: SPSS, tutoriel & guide de travaux pratiques en pdf.
Top Ten Things You Need to Know About: SPSS
What does SPSS stand for?
SPSS stands for ‘Statistical Package for the Social Sciences’. However, since the company wanted their product to be used for purposes other than social sciences, they changed the name to the initials that we know and love today.
Why use SPSS?
SPSS was originally developed at Stanford University in the 1960s as a rigorous statistical package to analyze sociological data. While SPSS is still an excellent choice for social science analysis, it has been extended to a wide-range of business, scientific and information modeling applications. Much of the usefulness of SPSS lies in its “good” statistical practices and its outstanding data presentation capabilities.
Reasons to choose SPSS
- Large data sets (1,000+ data points)
- Complex data interaction (multivariate analysis)
- Accurate statistical analysis (traceable analysis)
- Graphing (precise, customizable (templates), true-3-D graphing)
- Ease of data export (graphs, table, etc.)
Why is SPSS so complicated?
Don’t think ‘complicated’, think ‘complex’. SPSS is a powerful yet flexible data analysis tool
– while the learning curve is steep, the results are impressive.
What does “SPSS” stand for?
Statistical Product and Service Solutions (Glad you asked, eh?)
Umm, everything looks hard. Now what?
Run the SPSS tutorial (Help | Tutorial). SPSS is not a spreadsheet, more a blend between database and a spreadsheet. The tutorial gives a good overview of the structures and conventions used (your one your own for the statistics….)
How do I import an Excel File?
From the SPSS Data Editor (the default window), select File | Open | Data. Then make sure that the “Files of Type” pull-down menu displays “Excel Files (*.xls)”. Select your file and click on “Open”.
Hint: Importing complex Excel sheets can become an exercise in stress management quickly. Remove extraneous formatting if possible.
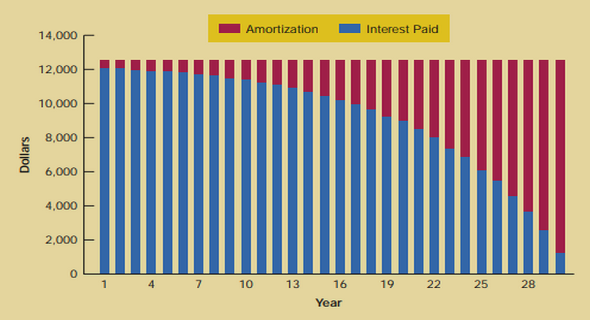
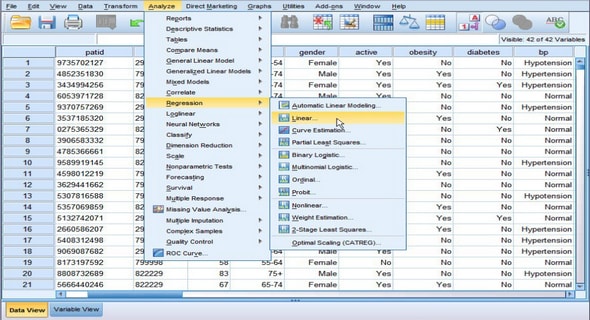
Ok, how about a simple bar graph?