Frequency Tables
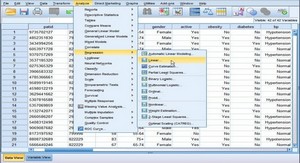
Frequency tables include lists of values (categories) within each selected variables and the number of times each category occurs.
To create a table of frequencies (number of occurrences of given categories), select Analyze → Descriptive Statistics → Frequencies.
Select the variables to be depicted in the frequency table by moving them from the left- to the right-hand box. SPSS provides the user additional options, including statistics, charts, and format.
Statistics
SPSS will, by default, print the values of the selected variables and the frequencies of each. If you prefer additional information, click Statistics:
Options include percentile values. SPSS will print quartiles (fourths) or the values that divide the data into X equal groups (cut points). The number of groups is defined by the user. SPSS will also print selected percentiles. Simply, select Percentile(s), then type in the percentile of interest and click Add. We have selected thirds.
You may also select descriptive statistics, like measures of central tendency and dispersion, as well as statistics describing the distributions. When finished, select Continue.
Charts
This option allows users the opportunity to view bar charts, pie charts, or histograms in addition to the frequency table. This might be useful if there are many categories for each variable or if two or more variables are to be compared. The charts may contain frequencies or percentages.
Format
With this option, users can determine the order in which categories will appear and whether or not multiple variables should be compared. This will impact how results are presented.
To cut back on the amount of output, users may choose not to view tables with many categories (categories).
When finished click Continue to return to the variable-selection window. Then click OK.
Output
The new analyses are added to the descriptive statistics. Notice the addition in the left-hand frame.
The following statistics are for the variable test.
Notice there are a total of six cases, and none are missing.
The mean test score is 79.833, the median is 79.5. The value of 71.75 cuts off the 25th percentile (25% of cases fall at or below this value), and so on.
If we scroll down the page, we will find additional results:
This table lists all the values of the variable test and the frequency of occurrence of each. Notice there is only one occurrence of each value.
Tutorial introduction à l’analyse exploratoire des données avec SPSS (832 KO) (Cours PDF)