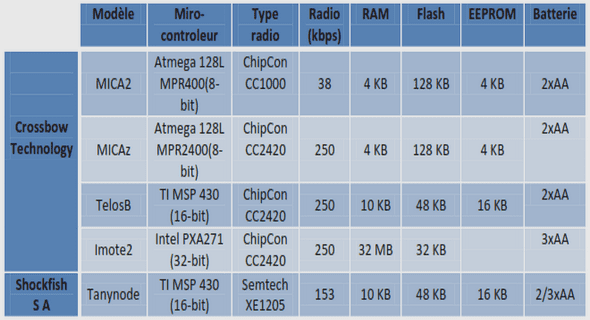
CALCULATION OF RESULTS
Create a standard curve by reducing the data using computer software capable of generating a four parameter logistic (4-PL) curve fit. As an alternative, construct a standard curve by plotting the mean absorbance for each standard on the y-axis against the concentration on the x-axis and draw a best fit curve through the points on the graph. The data may be linearized by plotting the log of the human IL-6 concentrations versus the log of the O.D. and the best fit line can be determined by regression analysis. This procedure will produce an adequate but less precise fit of the data.Inter-assay Precision (Precision between assays) Three samples of known concentration were tested in twenty separate assays to assess inter-assay precision. Assays were performed by at least three technicians using two lots of components.
SENSITIVITY
The MDD was determined by adding two standard deviations to the mean optical density value of twenty zero standard replicates and calculating the corresponding concentration.To assess the linearity of the assay, samples were spiked with high concentrations of human IL-6 in various matrices and diluted with the appropriate Calibrator Diluent to produce samples with values within the dynamic range of the assay.This immunoassay is calibrated against highly purified E. coli-expressed recombinant human IL-6 produced at R&D Systems. The NIBSC/WHO 1st International Standard for IL-6 (89/548), which was intended as a potency standard, was evaluated in this kit. The NIBSC/WHO standard is a CHO cell-derived recombinant human IL-6.This immunoassay is calibrated against highly purified E. coli-expressed recombinant human IL-6 produced at R&D Systems. The NIBSC/WHO 1st International Standard for IL-6 (89/548), which was intended as a potency standard, was evaluated in this kit. The NIBSC/WHO standard is a CHO cell-derived recombinant human IL-6.The dose response curve of the International Standard (89/548) parallels the Quantikine standard curve. To convert sample values obtained with the Quantikine Human IL-6 kit to approximate NIBSC 89/548 units, use the equation below.
SAMPLE VALUES
Serum/Plasma – Forty serum and plasma samples from apparently healthy volunteers were evaluated for the presence of human IL-6 in this assay. Thirty-three samples measured less than the lowest standard, 3.13 pg/mL. Seven samples measured between 3.13 and 12.5 pg/mL. No medical histories were available for the donors used in this study.Cell Culture Supernates – Human peripheral blood mononuclear cells (1 x 10⁶ cells/mL) were cultured in RPMI supplemented with 10% fetal calf serum, 50 μM β-mercaptoethanol, 2 mM L-glutamine, 100 U/mL penicillin, and 100 μg/mL streptomycin sulfate and stimulated for 1, 3, and 5 days with 10 μg/mL PHA. Aliquots of the culture supernates were removed on days 1, 3, and 5 and assayed for levels of natural human IL-6. Results are listed in the following table.
The factors listed below were prepared at 50 ng/mL in Calibrator Diluent RD5T and at 100 ng/mL in Calibrator Diluent RD6F and assayed for cross-reactivity. Preparations of the following factors at 50 ng/mL in a mid-range rhIL-6 control prepared in Calibrator Diluent RD5T and 100 ng/mL in a mid-range IL-6 control prepared in Calibrator Diluent RD6F were assayed for interference. No signifi cant cross-reactivity or interference was observed. Monocytes were prepared from human PBMCs by adherence to plastic. Adherent monocytes were washed, replated, and allowed to rest for 24 hours. Pretreatments were for 30 minutes: neutralizing anti-human TNF-α (R&D Systems, Catalog # MAB610) at 5 μg/mL, H7 serine kinase inhibitor (Tocris, Catalog # 0542) at 10 μM, or HU211 NFκB inhibitor (Tocris, Catalog # 2861) at 10 μM. Following the pretreatment, 500 ng/mL LPS or 30 ng/mL okadaic acid (OA, Tocris, Catalog # 1136) was added for 20 hours as indicated. Conditioned media was tested in the Quantikine ELISA, resolved by SDS-PAGE, transferred to a PVDF membrane, and immunoblotted with the detection antibody used in this kit. The immunoprecipitation/ Western blot shows direct correlation with the ELISA value for these samples.
Material and Methods: Primary human gingival fibroblasts were cultured for 24 and 48 h with a-tocopherol at various concentrations (0, 50, 100 and 200 lM) in the presence or absence of 1 lg/mL of LPS. At the end of each time point, cell adhesion and growth were evaluated by means of optical microscope observa- tions and MTT assay. The secretion levels of cytokines interleukin (IL)-1b and IL-6 and human b-defensins 1 and 2 were measured by specific enzyme-linked immunosorbent assay. Finally, an in vitro scratch wound assay was performedto investigate the effect of a-tocopherol on fibroblast migration.Results: a-tocopherol alone had no adverse effect on cell adhesion and morphol- ogy. Fibroblast proliferation increased in the presence of a-tocopherol with and without LPS. a-tocopherol alone had no effect on inflammatory cytokine (IL-1b and IL-6) secretion. Interestingly, following cell exposure to P. gingivalis LPS, a-tocopherol significantly (p < 0.01) decreased the secretion of these two cytoki- nes and increased human b-defensin-1 and -2 secretion. Finally, a-tocopherol increased the healing rate of the gingival fibroblasts from 12 h up to 48 h.