THOR abdomen prototype improvements
Subcomponent tests
Lumped element model
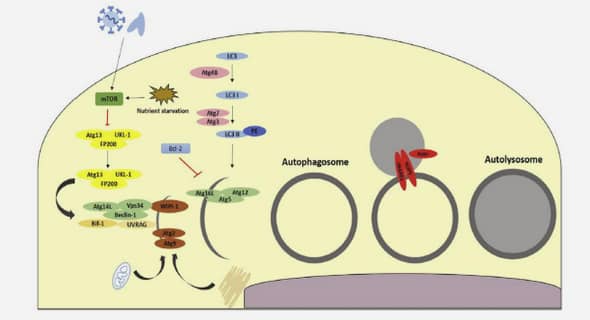
A simplified model of the human abdomen was built to reproduce dynamic loading tests on the human abdomen and on the THOR dummy abdomen. The aim of this lumped element model is to determine the main characteristics of the human abdomen response under impact and to improve the biofidelity of the THOR dummy abdomen.
Previous models
A lumped element model was proposed in Trosseille et al. 2002 where the abdomen was approximated by a spring in parallel with a damper to simulate a seatbelt test (see Figure 3.1a). This was representing the contribution of a static and a dynamic force to the abdomen response. The abdomen force was computed from the test penetration and penetration velocity data with the relationship F = K· x+C· x˙. The parameters were identified from test data using an analytical method. Trosseille et al. 2002 also developed a lumped element model applied to the THOR dummy. A mass M was added at the front of the model used for the PMHS subjects and a non-linear spring was used giving an F = K0 · L L − x · x contribution, L being the thickness of the foam layers of the dummy abdomen. The parameters identified for the PMHS subjects were on average K = 12 850 N m−1 for the stiffness contribution and C = 765 N m−1 s for the damping contribution. For the THOR dummy, L was set to 0.12 m and the average parameters were M = 0.15 kg, K0 = 11 225 N m−1 and C = 193 N m−1 s. Figure 3.2 shows the validation of the model versus THOR and PMHS data. In Lamielle et al. 2008 seatbelt tests, the use of force sensors between the back of the subject and the testing apparatus allowed a more detailed modelling consisting in two spring / damper models in series with a mass in between (see Figure 3.1b). The model parameters were identified from test data with a similar method as in Trosseille et al. 2002. Then the resolution of the model was performed with a 4th order Runge-Kutta method having the abdomen force from test data imposed. The belt displacement and velocity were then compared to test data. The parameter K1 was identified first in a Fback versus x1 diagram by fitting a cubic curve (Fback = K1 · x 3 1 ) through the point x max 1 3 ; Fback x max 1 3 . The measured Fback data had been scaled before with a factor comprised between 0.8 and 1.2 in order to have a force equal to zero after the unloading . C1 was then determined for each test fitting a cubic curve in a Fback − K1 · x 3 1 versus x˙1 diagram. However, the determination of K1 does not take into account the contribution of C1 to Fback. The parameters K and C were determined in a similar way for each test. The same remark can be expressed that the determination of K does not take into account the contribution of C to the force F. The average parameters found for the first block of the model representing the part of the abdomen between the front wall and the centre of gravity were K = 13 000 kN m−3 and C = 665 N m−1 s. The mass representing the abdomen was chosen as M = 14 kg. The second block was showing much more stiffness with K1 = 800 000 kN m−3 and C1 = 3940 N m−3 s 3 . The components K, K1 and C1 were non linear components with a cubic relationship, for instance F = K · x 3 . Similarly, F = K1 · x 3 and F = C1 · x˙ 3 in the other components. But F = C · x˙ for the C component. Figure 3.3 shows the validation of those models versus PMHS data.A thorax model for an impactor test was developed in Lobdell et al. 1973, consisting of a mass representing the impactor (m1), a mass representing the sternum, the ribs and the thoracic content (m2) and a mass representing the spine (m3). These masses are linked by the spring k12 representing the thorax skin and a block of springs and dampers representing the ribcage and the thoracic content. The components are linear except k23 that is bi-linear in order to match the target corridors for large deflections and c23 that has different damping values for tension and compression in order to model force decay. The initial velocity of the impactor was applied as input condition of the model. Figure 3.4a shows the models. The resolution of the system’s equations was performed until the force in spring k12 became tensile. The model parameters has been estimated arbitrary for some of them and determined from curve fitting load-deflection data for the others. This model was used in Kent et al. 2004 to simulate an impactor test. The initial velocity of the impactor was applied as input condition. To simulate a belt loading the displacement-time curve was applied to a simplified version of the model with the impactor mass removed and m3 being fixed as seen on Figure 3.4b. The coefficients of the original model were used. An other simplified version of the model from Lobdell et al. 1973 has been used in Parent et al. 2013 for thoracic impactor loading. The behaviour of k23 and c23 is the same as in the original model and the viscoelastic branch was removed. The input condition is the initial velocity of the impactor. The model parameters were optimised the sum of the normalised distances between the model response and target point in the force-deflection diagram as objective function. The initial values of the parameters were selected as the best among random values between 0.1 and 10 time the original values from Lobdell et al. 1973.
Proposed model
In order to be able to reproduce the PMHS or dummy response with the same model for both seatbelt and impactor case, a new model needed to be developed. The two stages of the model are meant to represent the deformable behaviour of the organs on one hand and the one of the flesh and skin in the other hand. Each stage of this model consists of a spring and a damper in order to represent a visco-elastic behaviour. This model was built modifying the model from Lamielle et al. 2008. First, linear elements were used instead of components with a cubic relationship. A mass has been added at the front of the model to represent the flesh and skin mass. In order to be able to represent an impactor as well as a seatbelt loading case, a mass has been added at the back of the model to represent the global subject mass. This mass is fixed to model a seatbelt loading and let free to model an impactor test. More important, a modification of the structure of the model needed to be done in order to represent both seatbelt and impactor loading cases. Indeed, the original model from Lamielle et al. 2008 can model a seatbelt test but not an impactor test. Since the extremity of the model has a non-zero initial velocity, the fact of having a damper in parallel creates a non-zero initial reaction force. This is in contradiction with the test data. Therefore, it was chosen to transform the front stage of the model into a spring in series with a damper (Maxwell model), in order to have a similar front stage as the model from Lobdell et al. 1973. Figure 3.5 shows the models for seatbelt and impactor loading cases
Test data
All test data available in the literature on the THOR dummy were concerning the NT version. Therefore, although the Mod-kit is the last version of the dummy, this lumped element model study will be based on the NT version data.
Seatbelt
The seatbelt tests selected from the literature and applied to the lumped element model are taken from Trosseille et al. 2002 and Foster et al. 2006 for the PMHS tests. For the THOR dummy, tests from Compigne et al. 2015 (replication of tests from Foster et al. 2006) and Trosseille et al. 2002 were selected. These are fixed-back tests where the belt is placed on the abdomen at the umbilicus level and retracted toward the back of the subject thanks to pretensioners. Three conditions from the literature are common to PMHS subjects and the dummy: B and C conditions from Foster et al. 2006 (different pretensioners) and configuration 2 from Trosseille et al. 2002. These conditions were selected to be reproduced with the developed lumped element model. The average penetration across all the tests for a given condition was applied to the model. The average force was compared to the model response. The average penetration was differentiated to obtain velocity and then differentiated a second time to determine acceleration. The three signals were filtered with a CFC filter which filtering frequency was adjusted according to a FFT 1 analysis in order to avoid noise that would distort the model computations. Average penetration, velocity and acceleration were applied to the model and the average force was compared to the model response. Figure 3.6 shows those input conditions applied to the lumped element model overlaid together. It can be seen that all the input conditions do not have the same time duration and for some of them the data is not available over the full time range of the test.