The Lower and Middle Triassic strata of the Alberta basin
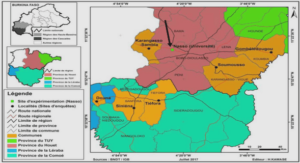
In Western Canada, Triassic strata are present in two basins: (1) the Alberta basin (Figure V – 1) and (2) the Williston Basin (North Dakota and South Saskatchewan, Edwards et al., 1994). In the Williston basin, the Triassic interval is only composed of non-marine deposits (Cumming, 1956; Carlson, 1968; Edwards et al., 1994) whereas in the Alberta basin, the Lower to Middle Triassic strata records marine environments (Armitage, 1962, Davies, 1997; Davies et al., 1997; Orchard and Zonneveld, 2009). In this basin, the marine deposits of the Lower and Middle Triassic (approx. duration of 15 My) are divided into three formations from older to younger: the Montney, Doig and Halfway Formations. In the foreland basin of the Canadian cordillera (WCSB on Figure V – 1), the Lower and Middle Triassic strata are stratigraphically between the Permian Belloy Formation and the Upper Triassic Charlie Lake Formation or the Jurassic erosive unconformity. The studied formations are mainly composed of fine-grained sandstones, siltstones and shales (Armitage, 1962, Gibson, 1974; Gibson, 1975; Davies, 1997; Gibson and Edwards, 1990; Davies et al., 1997; Zonneveld et al., 2010, Crombez et al., submitted). Studies on the sedimentology and depositional environments of this interval highlight a wave dominated environments, including phosphatic shales layers (Armitage, 1962, Gibson, 1974; Gibson, 1975; Evoy and Moslow, 1995; Davies et al., 1997; Evoy, 1997; Zonneveld et al., 2010, Golding et al., 2014; Crombez et al., submitted), turbiditic deposits (Moslow and Davies, 1997; Crombez et al., submitted) and evaporitic environments for the top of the Middle Triassic deposits (Davies, 1997; Zonneveld, 1999). Various works on biostratigraphy (Orchard and Tozer, 1997, Orchard and Zonneveld, 2009; Golding et al., 2015a) show that the Montney Formation was deposited in the Lower Triassic and the Doig-Halfway Formations were deposited in the Middle Triassic. The geodynamic setting during the deposition of the Lower and Middle Triassic strata is still a matter of debate. According to Davies et al. (1997), the Montney and Doig Formations were deposited on the western passive margin of the Pangea, whereas Golding et al. (2015b) suggested that these formations were deposited in an early foreland basin.
Data and methods
1. Data
The present work is based on publicly available data from more than 2000 wells (Geowebworks, IHS Data Manager and Divestco Energisite) collected and gathered in a PETREL database. These well logs were completed by 22 sedimentological sections from 18 cores and 4 outcrops (Figure V – 1). This database also includes cuttings samples from the studied interval coming from three wells (Figure V – 1). From this database, 400 wells were selected along 18 regional crosssections in order to reconstruct the stratigraphic architecture of the Lower and Middle Triassic. 2. Methods a. Sedimentology and sequence stratigraphy This study is based on facies descriptions from cores, interpretation of depositional environments and upscaling to well log data (Gamma Ray) for regional correlation (Crombez et al., submitted). This interpretation also benefits from the description and analysis of outcrop sections of Middle Triassic strata. The analysis of the stacking pattern and spatial distribution of depositional environments makes it possible to define shoreline trajectories (Helland-Hansen and Martinsen, 1996; Helland-Hansen and Hampson, 2009) and to identify the major time surfaces: end of regression, end of transgression, onset of base level fall and end of base level fall (Catuneanu, 2006, Catuneanu et al., 2009). Following the terminology proposed by Hunt and Tucker (1992) and Helland-Hansen and Gjelberg (1994), these time surfaces were used to reconstruct the 3D stratigraphic architecture of the studied interval. b. Mineralogical analyses In addition to core and outcrop descriptions, cuttings from three wells were sampled in order to quantify the mineralogy of the Triassic strata. QEMSCAN analyses (Gottlieb et al., 2000) were performed by SGS Canada Inc. on 201 samples. QEMSCAN is based on backscattered-electron imaging and energy dispersive X-ray spectroscopy techniques.
Sedimentary environments and depositional model
Detailed descriptions of the sedimentary facies were presented in a previous paper (Crombez et al., submitted). In the present study, two additional environments were highlighted: (1) fluvial deposits; characterized by fine- to medium-grained well sorted sandstones, with through cross stratification and erosional bases, (2) sebkha deposits, characterized by heterolitic, reddish sandstones and clays with gypsum nodules.Middle Triassic, eight main sedimentary environments are recognized: (1) offshore environments, characterized by massive to planar laminated dark grey siltstones (Figure V – 2A and B), (2) turbiditic environments, characterized by massive to heterolitic fine-grained sandstones with current and climbing ripples (Figure V – 2C), (3) offshore transition environments, characterized by fine-grained heterolitic sandstones and siltstones with hummocky cross stratification (Figure V – 2D), (4) shoreface environments, characterized by massive to heterolitic fine-grained sandstones and siltstones with swalley cross stratification or low angle cross-stratification (Figure V – 2F and G), (5) tidal environments, characterize by heterolitic sandstones and siltstones with bidirectional current ripples (Figure V – 2H), (6) foreshore environments mainly characterized by bioclastic sandstones (Figure V – 2I), (7) sebkha environments with reddish, heterolitic sandstone and clays with common gypsum nodules (Figure V – 2J) and (8) fluvial deposits, characterized by fine- to medium-grained well sorted sandstones, with through cross stratification and erosional bases. All the marine environments presented above are characteristic of a wave dominated shelf (Posamentier and Walker (eds), 1992). In our work, no clear evidences of deltaic environments were highlighted but previous studies identified these environments below the Jurassic unconformity along the erosional edge (Zonneveld et al., 2010). On Figure V – 2, the typical Gamma Ray patterns of the main environments are presented. The figure shows that offshore and offshore transition facies present high Gamma Ray (GR>100°API) with coarsening upward trends. Shoreface and foreshore deposits present the same coarsening upward trend but with lower Gamma Ray values (shoreface GR<75°API, foreshore environments GR<50°API) interpreted to be linked to the higher sand content. Turbiditic deposits are characterized by a major drop in the Gamma Ray interpreted to represent the sharp depositional contact of sandstones above offshore facies. Unlike shoreface and foreshore environments, turbiditic deposits often present fining upward trends, interpreted to represent the lateral migration and/or waning of the turbiditic system. Turbiditic deposits also typically show high amplitude GR variations associated with high frequency changes in depositional energy. Tidal deposits present a blocky pattern that is interpreted to represent the sharp transition between heterolitic tidal flats deposits with sandy tidal channel deposits. The recognition of these distinctive patterns provides a mean to identify depositional environments and therefore vertical changes in relative depositional bathymetry on well logs.
Stratigraphic architecture along the 2D well sections
The synthetic stratigraphic architecture of the Montney, Doig and Halfway Formations is presented on Figure V – 3. On this figure, the first three sequences that compose the Montney Formation are interpreted to be part of the first second order cycle (Sequence A) described by previous studies (Gibson and Barclay 1990; Edwards et al., 1994; Davies, 1997) and the last sequence, that compose the Doig-Halfway Formations is part of a the second cycle (Sequence B). IFP Energies nouvelles – 1 et 4 avenue de Bois-Préau – 92852 Rueil-Malmaison Cedex – France ISTeP, UPMC – 4 pace Jussieu – 75005 Paris – 95 – Out of the eighteen sections realized for the present study, three are presented in this study. Figure V – 4 presents a 375km long SE-NW section with 25 wells, Figure V – 5 presents a 275km long NE-SW section with 18 wells and Figure V – 6 present a 625 km long SSE-NNW with 25 wells. All sections cross the entire Lower and Middle Triassic strata of the Alberta basin. On the sections the studied interval rests on the Permian Belloy Formation. In the Eastern part of the basin, the studied interval is truncated by the Jurassic Nordegg Formation and by the Middle Triassic Copplin unconformity, whereas in the western part, it is capped by the upper Middle Triassic Charlie Lake Formation. In the present work, all sections are flattened on the sequence boundary 4 (SB4)


