Antiproliferative cardenolide glycosides of Elaeodendron alluaudianum from the Madagascar Rainforest
Introduction
In our continuing search for biologically active natural products from tropical rainforests as part of an International Cooperative Biodiversity Groups (ICBG) program,2 we obtained an extract of the stems of a plant initially identified as a Hippocratea sp. from Madagascar. The extract had significant antiproliferative activity against the A2780 ovarian cancer cell line, and it was thus selected for bioassay-guided fractionation. While the work was in progress the plant was reidentified as Elaeodendron alluaudianum H. Perrier (Celastraceae). As noted previously,3 there are about 40 species in the genus Elaeodendron from the Mexican coast, Bermuda, Africa, Madagascar (incl. the Mascarenes), India, Melanesia, and Australia.4 The plants in this genus are usually glabrous trees or shrubs,4 and flavonoids,5 terpenoids,6 and cardenolides7 have been isolated from them. The cytotoxicities and cardiac activities of cardenolides have been widely studied.8 The extract of E. alluaudianum had an IC50 value of 3.3 lg/mL against the A2780 human ovarian cancer cell line. The crude extract afforded two new cardenolide glycosides, designated elaeodendroside V (1) and W (2), after solvent partitioning and reversed-phase C18 HPLC. Herein, we report the structural elucidation of the two new cardenolide glycosides and their bioactivities against the A2780 human ovarian cancer cell line and the U937 human histiocytic lymphoma cell line. 2. Results and discussion Elaeodendroside V (1) was obtained as a white amorphous solid. Its molecular formula was established as C35H54O16 on the basis of a protonated molecular ion peak at m/z 731.3496 in its HRFAB mass spectrum. Its 1 H NMR spectrum in CD3OD showed characteristic signals of an a,b-unsaturated c-lactone (dH 5.01, dd, J = 18.4, 1.6 Hz, H-21a; dH 4.92, dd, J = 18.4, 1.6 Hz, H-21b; and dH 5.91, s, H-22) (Table 1). Its 13C NMR spectrum contained 0968-0896/$ – see front matter 2008 Elsevier Ltd. All rights reserved. doi:10.1016/j.bmc.2008.10.092 q See Ref. 1. * Corresponding author. Tel.: +1 540 231 6570; fax: +1 540 231 7702. E-mail address: dkingston@vt.edu (D.G.I. Kingston). URL: http://www.kingston.chem.vt.edu/ (David G.I. Kingston). Bioorganic & Medicinal Chemistry 17 (2009) 2215–2218 Contents lists available at ScienceDirect Bioorganic & Medicinal Chemistry journal homepage: www.elsevier.com/locate/bmc 35 signals (Table 2), which were assigned as two methyls, 11 methylenes (including three oxymethylenes), 16 methines (including 12 oxymethines and one olefinic carbon), and six quaternary carbons (including two oxyquaternary carbons, one olefinic carbon and one carbonyl carbon) based on 13C NMR (Table 2) and HSQC spectra. The complete 1 H and 13C NMR signal assignments and connectivity were determined from a combination of COSY, TOCSY, HSQC, and HMBC data and comparison with the spectra of known cardenolides.9 COSY and TOCSY correlations established three spin systems, which were H2-1H2-2H-3Y2-4 in ring A, H2-6H2-7H8Y9H-11H2-12 in rings B and C, and H2-15H2-16H-17 in ring D (Fig. 1). Further assembly of rings A–D and the a,b-unsaturated c-lactone of the aglycone was determined on the basis of HMBC correlations. HMBC correlations of H2-19 to C-1, C-5, and C-9, H2-1 to C-9, and H2-6 to C-5 established the connectivity of rings A and B. Correlations of H2-12, H2-16, H-17, and H3-18 to C-13 and of H2-16 and H3-18 to C-14 indicated the connectivity of rings C and D. In the meantime, an HMBC correlation of H2-16 to C-20 suggested the location of the lactone ring at C-17 (Fig. 1). These correlations established the flat structure of the aglycone of 1. The structures of the sugar moieties of 1 were determined by 1D TOCSY, COSY, and HMBC data. Two sugar units were clearly shown by COSY and TOCSY correlations of two spin systems, H10 H-20 H-30 H-40 H-50 H3-60 and H-100H-200H-300H-400H500H2-600 (Fig. 1). An HMBC correlation of H-3 to C-10 indicated the sugars were connected to the aglycone at C-3. In the meantime, HMBC correlations of H-100 to C-40 and of H-40 to C-100 established that the two sugars were connected from C-100 to C-40 (Fig. 1). The relative configuration of the aglycone of 1 was established by analysis of its ROESY correlations and calculation of coupling constants (Fig. 2 and Table 1). The ROESY correlations of H3-18 to H-22, H2-21, H-8, and H-11, and of H2-19 to H-8 and H-11 indicated that the C-17 side chain, H-8, H-11, and the oxymethylene at C-10 were all b-oriented. Calculation of coupling constants of H-11 (td, J = 9.8, 4.2 Hz) suggested that the adjacent H-9 occupied sent in the spectra of 1 (Tables 1 and 2). Those data indicated that 2 had a similar structure to 1 except that 2 has an aldehyde instead of a hydroxymethyl group at C-19. Further comparison of the 1 H and 13C NMR spectra of 2 and the known cardenolide glycoside, sarmentosigenin-3b-O-b-6-deoxyguloside,8l confirmed the assignments, since the 1 H NMR and 13C NMR data of the aglycone of 2 were identical to the literature data for sarmentosigenin. The structure of 2 was further confirmed by analysis of 2D NMR spectra including COSY, HMQC, HMBC, and ROESY spectra. Therefore, the structure and configuration of 2 was determined as sarmentosigenin-3b-O-[b-allosyl-(1 ? 4)-b-6-deoxyalloside]
General experimental procedures
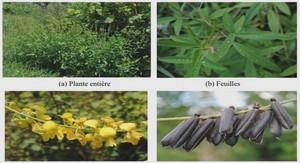
Optical rotations were recorded on a JASCO P-2000 polarimeter. IR and UV spectra were performed on MIDAC M-series FTIR and Shimadzu UV-1201 spectrophotometers, respectively. NMR spectra were obtained on JEOL Eclipse 500, Varian Inova 400, and Varian Unity 400 spectrometers. Mass spectra were obtained on a JEOL-JMS-HX-110 and an Applied Biosystems 4800 MALDI-TOF/ TOF instruments. Chemical shifts are given in d (ppm), and coupling constants (J) are reported in Hz. HPLC was performed with Shimadzu LC-10A pumps coupled with a Varian Dynamax semipreparative C18 column (250 10 mm). Both HPLC instruments employed a Shimadzu SPD-M10A diode array detector. 3.2. Antiproliferative bioassay The A2780 ovarian cancer cell line assay was performed at Virginia Polytechnic Institute and State University as previously reported.12 The A2780 cell line is a drug-sensitive ovarian cancer cell line.13 The U937 human histiocytic lymphoma cell line assay was performed at Eisai Research Institute. The cells were cultured in 96- well plates in the absence or continuous presence of 0.005 to 10 lg/mL extract for 96 h. Cell growth was assessed using the CellTiter-Glo Luminescent Cell Viability Assay (Promega) according to the manufacturer’s recommendations. Luminescence was read on the EnVision 2102 Multilabel Reader (Perkin-Elmer). IC50 values were determined as the concentration of an extract at which O OH HO OH HO O O O OH OH O O OH HO HO OH Figure 1. Key COSY (bold) and HMBC (arrows) correlations of 1. O O H O O O HOCH2 HO H H H HO H CH3 H H HO H H HO OH O HO H H H HO H OH OH H Figure 2. Key ROESY correlations of 1. Y. Hou et al. / Bioorg. Med. Chem. 17 (2009) 2215–2218 2217 cell growth was inhibited by 50% compared to untreated cell population. Two independent repeating experiments were performed. 3.3. Plant material Root, stem, and leaf samples of Elaeodendron alluaudianum H. Perrier (Celastraceae) were collected in the forest of Bemosa, a dense humid forest, in northern Madagascar, at an elevation 200 m, at 13.14.17S, 49.37.50E, on November 2, 2005. The tree was 10 m high with diameter at breast height of 12 cm and white flowers. It was identified by R. H. Archer (South African National Biodiversity Institute); its assigned collector number is Randrianaivo et al. 1281.