Modeling anaerobic bioreactor landfills in methanogenic phase
Introduction Biodegradation of municipal solid waste (MSW) in landfills is a complex and variable process
Landfills develop distinctive microbial ecosystems during different decomposition phases. Waste decomposition phases ranging in number from three to six or more have been identified by different investigators depending on the data-base and purposes of each study. A four-phase characterization of refuse decomposition (Barlaz et al., 1989) consists of an aerobic phase, an anaerobic acid phase, an accelerated methane production phase and a decelerated methane production phase. In the accelerated methane production phase there is a rapid increase in the rate of methane production to some maximum value. Methane concentration of 50–70% is typical of this phase with the balance of the gas being mainly carbon dioxide. There is a little hydrolysis of solids during this phase and the methanogenic biomass increases. In the fourth phase of waste decomposition, decelerated methane production phase, the rate of methane production decreases even though methane and carbon dioxide concentrations remain constant at about 60% and 40%, respectively. Hydrolysis of solids controls the rate of methane production in that there is no longer an accumulation of carboxylic acids to serve as soluble substrate.
Mathematical model
Main assumptions
Some important assumptions of this model are: 1) the landfill is considered as a homogeneous and anisotropic three-phase porous medium. The three phases are solid waste, gas and leachate, where gas is considered as a mixture of CO2 and CH4 with equal percentages (50% for each gas), 2) the solid phase of the landfill is considered to be non-deformable which means that we just consider the effects of degradation on gas and heat production and not on deformation and settlement of the landfill, 3) the gas and liquid phases are considered to be immiscible and Darcy’s law is applicable for both fluid phases, 4) there is a thermal equilibrium between the three phases and 5) thermal radiation is neglected. Finally to simplify the model and to avoid a long list of undefined parameters, only one type of biomass (methanogenic biomass) is considered in the biological model. 2.2. Hydrodynamic model As mentioned, the hydrodynamic model is based on mass and energy conservation equations. The mass conservation equation for each liquid phase is expressed by: vmP vt þ V: rP krPk mP ð VPP þ rPgÞ ¼ abP (1) where ml ¼ fSrl, mg ¼ fð1 SÞrg are the masses of phaseP ¼ l; g per unit volume of porous medium (kg/m3 ), ab is the production rate for each phase, S is the liquid saturation and f and k are the porosity and absolute permeability (m2 ) of the porous medium (landfill waste). rP, krP and PP are the density, relative permeability and pressure for phase p. Gas density is defined by the perfect gas law, rg ¼ PgMg/RT, where Mg is the molecular mass of the mixture of methane and carbon dioxide and R is the universal gas constant. Gas pressure is defined as the sum of the liquid and capillary pressures. For the relative permeability and capillary pressure we have used Van Genuchten’s (1980) model: krl ¼ S2 e h 1 1 S1=m e mi ; krg ¼ ð1 SeÞ 2 h 1 S1=m e im (2) 2 water research xxx (2008) 1–11 ARTICLE IN PRESS Please cite this article in press as: Gholamifard, S. et al., Modeling anaerobic bioreactor landfills in methanogenic phase: Long term and short term behaviors, Water Research (2008), doi:10.1016/j.watres.2008.09.040 CemOA : archive ouverte d’Irstea / Cemagref where krl and krg are the relative permeabilities of fluid and gas, respectively, m is Van Genuchten’s parameter, Se ¼ (S Sr)/(1 Sr) is the effective saturation which defines the mobile fluid in a medium and Sr is the residual saturation. Capillary pressure is expressed by: Pc ¼ rlgjðSÞ; jðSÞ ¼ 1 a S1=m e 1 1=n (3) where n ¼ 1=ð1 mÞ and aðm1Þ is a parameter which defines the capillary height. The energy equation can be written as follow: T dh dt þ X P¼l;g gP dmP dt ¼ V:ðhPrPVPÞ V:q þ aq (4) VP, hP(PP,T ), q, g and T are respectively Darcy’s velocity of phase P, enthalpy per mass unit of phase P, conductive heat flux defined by Fourier’s law as q ¼ lVT, gravity acceleration and temperature. gP is defined as: gPðPP; TÞ ¼ hPðPP; TÞ ThPðPP; TÞ, where hPðPP; TÞ is the entropy per mass of phase P. aq is the heat source added to the model using the biological model of gas and heat production.
Biological model
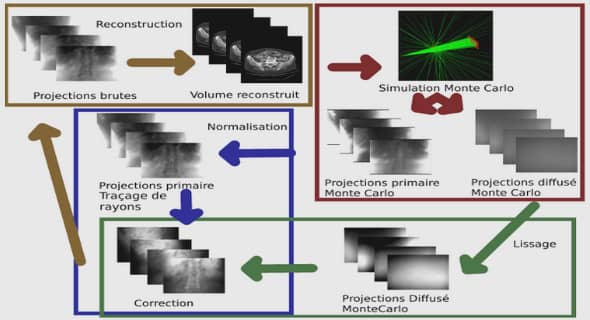
The biological model consists of different parts corresponding to different steps of the degradation process. Fig. 1 shows the structure of this model and different steps of degradation of the solid substrate: production of volatile fatty acids (VFA) from hydrolysis and finally methanogenic biomass and biogas production. VFAs serve as the precursor for methane production. High VFA concentrations inhibit both methanogenesis and hydrolysis/acidogenesis (Vavilin et al., 2002). This model is presented by Eqs. (5)–(10).
Hydrolysis
The most important part in the biodegradation process of the solid substrate in landfills is hydrolysis, which is represented using first order kinetics (El Fadel and Findikakis, 1996): dA dt ¼ X3 i¼1 ½Ai:liðTÞ:fsðAsÞ:Sl (5) Ai is the fraction of each biodegradable component of solid substrate which could be rapidly: i ¼ 1, fairly: i ¼ 2 and slowly: i ¼ 3 biodegradable and liðTÞ is the degradation kinetic for each biodegradable component Ai defined by Arrhenius Law: liðTÞ ¼ bi expð Eai=RTÞ (6) bi (s1 ) is a constant and Eai is the activating energy of each component. Sl is the saturation function described as: Sl ¼ ðS SminÞ=ð1 SminÞ, where Smin is considered as a minimum saturation in which hydrolysis could be stopped. This function considers the direct effect of saturation on acceleration of hydrolysis with increasing saturation. fsðAsÞ describes VFA inhibition of hydrolysis. The inhibition terms of hydrolysis and methanogenesis write respectively: fsðAsÞ ¼ 1 1 þ fAs=k1ð1 þ ka=HbÞg2; gsðAsÞ ¼ 1 1 þ fAs=k2ð1 þ ka=HbÞg2 (7) where As is the VFA concentration produced from hydrolysis of the solid substrate, ka is the dissociation constant, Hb is the proton constant and ki is the inhibition constant for i ¼ 1; hydrolysis and i ¼ 2; methanogenesis. 2.3.2. Gas production VFA: dAs dt ¼ b dA dt rAppðTÞ:gsðAsÞ: As KsA þ As :X aA:q dAs dZ (8) Biomass: dX dt ¼ Y:rAppðTÞ production :gsðAsÞ: As KsA þ As :X KdðTÞ decay X aX:q dX dZ (9) Biogas: dB dt ¼ ð1 YÞrAppðTÞ:gsðAsÞ: As KsA þ As :X (10) b is a stoichiometric coefficient, a is the fraction of VFA and biomass transferred by liquid flow, q is the volumetric liquid flow rate per surface area, KsA is the half saturation constant for acidogenesis (kg/m3 ) and Y is the methanogenic biomass formed per mass of VFA utilized (kg/kg). KdðTÞ ¼ Kd max:dD=dT and mAppðTÞ ¼ Y:rAppðTÞ ¼ mmax:gsðAsÞ:As=KsA þ As:dGr=dT are the decay and production rates of methanogenic biomass (d1 ), respectively, where Kd max and mmax are the maximum specific decay and production rates of methanogenic biomass (d1 ) at optimal temperature. In the existing biological models that we have found in the literature, the temperature is considered to be constant and these models are based on a constant value for production and decay of the biomass (El Fadel and Findikakis, 1996; Vavilin et al., 2002). As our model is based on a coupled behavior as a function of temperature it is very important to consider the temperature-dependence of bacterial activity. Fig. 2 shows the production, decay and growth rate curves used in our model. The growth rate is represented as the difference between production and decay rates and is usually introduced in the literature with Rosso’s law, without the negative side. Our conjecture is that it seems reasonable to prolong the curve, following the slope. This negative part shows that the decay rate of the biomass could exceed the production rate. Considering the maximum specific values of production and decay rates, it could be noticed that the negative part of this curve does not represent negative values of growth rate, but a higher rate of biomass decay compared to its production. Numerical tests show that if we do not introduce the negative part, the temperature does not remain at the asymptotic level observed on the landfill sites (see Fig. 3). The maximum value for this curve is obtained at the optimum temperature of 35 C which is considered to be the optimum temperature of mesophilic bacteria.